This content has been marked as final.
Show 14 replies
-
1. Re: Monitoring EJB pool
indranil32 Oct 26, 2013 1:05 PM (in response to ralf.penners)
If by amount you meant count then for MDB you can do that by :http://www.coderanch.com/t/318957/EJB-JEE/java/Read-JMS-Queue-subscriber-count
If you are comfortable with jConsole/VisualVM, then you do not even need any code : Follow : Using VisualVM with JBoss AS 7
-
2. Re: Re: Monitoring EJB pool
ralf.penners Oct 26, 2013 1:31 PM (in response to indranil32)
Yes sorry, I meant "count".
But my question is more related to stateless session beans.
The maxium pool size of SLSB can be configured in the standalone.xml like:
<strict-max-pool name="slsb-strict-max-pool" max-pool-size="20" instance-acquisition-timeout="5" instance-acquisition-timeout-unit="MINUTES"/>
What I am interested in is how many of them are currently used? Is there also a way to get that information through JMX? Or any other possibility?
-
3. Re: Monitoring EJB pool
indranil32 Oct 26, 2013 2:07 PM (in response to ralf.penners)
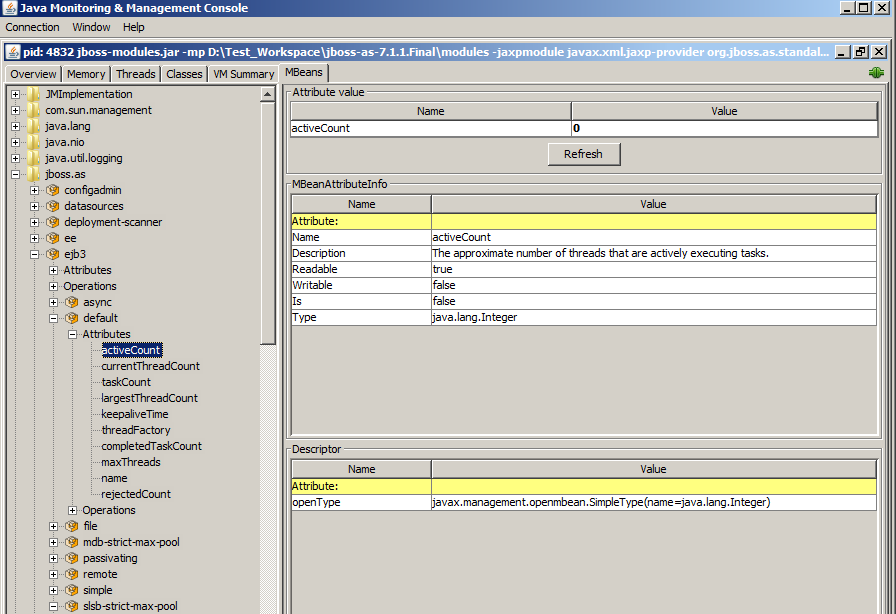
are u looking for this ? (see attachment)
-
slsb active count.png 61.6 KB
-
-
4. Re: Monitoring EJB pool
ralf.penners Oct 26, 2013 2:53 PM (in response to indranil32)
Yes, something like this.
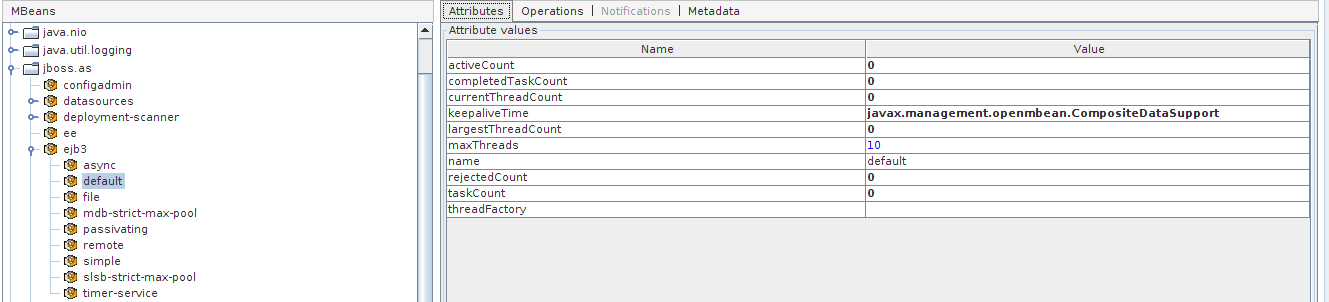
But I am not really sure, if that value counts the active SLSB.
Firstly, the counter is not increasing, while an application with SLSB is being executed. Secondly, the value "maxThreads" is set to 10 (please see my attachment), but the SLSB max-pool-size is set to 20.
When I looked through the JMX tree for the first time, I thought the entry "slsb-strict-max-pool" would have a counter for the active SLSB, but there you can just configure the same values like in the standalone.xml.
Maybe I am doing something wrong or any option needs to be activated, so that these statistics are collected.

-
5. Re: Monitoring EJB pool
indranil32 Oct 26, 2013 3:28 PM (in response to ralf.penners)
I don't think maxThreads and maxPoolSize needs to be of the same value.
To effectively see the counts, you really need to fire a high number of (may be concurrent) requests to your SLSB.
Can you paste your standalone.xml and the basic SLSB config that you are using?
-
6. Re: Monitoring EJB pool
ralf.penners Oct 26, 2013 4:03 PM (in response to indranil32)
I use the standalone.xml "out of the box", just like a fresh downloaded JBoss AS 7.1.1 Final instance.
Then you could put a simple application on the server. For example a servlet, which gets a SLSB providing some simple logic (maybe a Thread.sleep(100), mathematical calculation or something like this) injected.
So if you stress test this application afterwards with a tool like lets say Apache JMeter and build a testplan, which starts about 10-15 threads, then I think the counter should already start increasing.
-
7. Re: Monitoring EJB pool
indranil32 Nov 2, 2013 6:06 AM (in response to ralf.penners)
any luck seeing the count??
-
8. Re: Monitoring EJB pool
ralf.penners Nov 4, 2013 5:35 PM (in response to indranil32)
No, unfortunately not.
As stated here http://www.mastertheboss.com/jboss-performance/jboss-as-7-performance-tuning/page-3, there really seems to be currently no implementation like a counter or something else. So I'll hope, this will be added soon, because it would be very comfortable!
So for the moment I just need to leave the question unanswered. Nevertheless thank you for your help, I really appreciate it!
-
9. Re: Monitoring EJB pool
markus78 Nov 5, 2013 6:02 AM (in response to ralf.penners)
You can enable statistics for ejb with the CLI, something like this
/subsystem=ejb3:write-attribute(name=enable-statistics,value=true)
Not sure if that helps you, but perhaps you can try it out!
/Markus
-
10. Re: Re: Monitoring EJB pool
ralf.penners Nov 6, 2013 5:15 PM (in response to markus78)
Thank you for the hint, but if I enter that command via CLI I get the following output:
[standalone@localhost:9999 /] /subsystem=ejb3:write-attribute(name=enable-statistics,value=true) { "outcome" => "failed", "failure-description" => "JBAS014792: Unknown attribute enable-statistics", "rolled-back" => true } -
11. Re: Monitoring EJB pool
markus78 Nov 7, 2013 4:46 AM (in response to ralf.penners)
Im using EAP 6 , so perhaps it does not work for the community version, I will check it out.
-
12. Re: Monitoring EJB pool
ralf.penners Jan 11, 2014 1:13 PM (in response to ralf.penners)
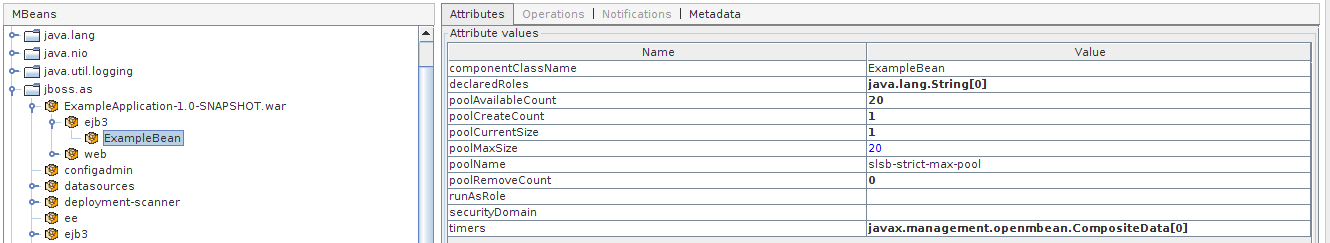
Finally I found an entry in the JMX tree of JBoss AS 7.1.1 Final, which will show at least the statistics for a specific bean (please see attached screenshot).
So you need to choose the deployed application and under that entry are some statistics about the components used in that application (like servlets, ejbs, etc.).
Just wanted to let you know!
-
13. Re: Monitoring EJB pool
rameshchokkapu May 19, 2014 12:10 AM (in response to ralf.penners)
Hi Ralf,
Good Morning..
Can u explain above it clearly ?
"Finally I found an entry in the JMX tree of JBoss AS 7.1.1 Final, which will show at least the statistics for a specific bean (please see attached screenshot).
So you need to choose the deployed application and under that entry are some statistics about the components used in that application (like servlets, ejbs, etc.)."
How did u get the attached screen?
-
14. Re: Monitoring EJB pool
ralf.penners Jul 31, 2014 10:23 AM (in response to rameshchokkapu)
Hi Ramesh,
sorry, I just noticed your reply today after logging in again for a while.
If you simply connect via JMX to the JBoss AS 7.1.1 Final (or any other version above) you will find these entries, which I showed on the screenshot.
I hope this will help you, otherwise don't hesitate to ask further questions.