Observations from two year of ping-backs from JBoss Tools users
Posted by maxandersen in JBoss Tools on Jul 30, 2012 9:06:19 AMAlmost two years ago we started including an opt-in ping-back functionallity to JBoss Tools and Developer Studio installations. The ping-back has in that time given us a lot of good and sometimes surprising information about our users.
In this blogpost I want to give you the highlights of these observations.
Disclaimer
Before I start I must underline that we do not track any individuals data and it is all opt-in, i.e. users need to explicitly say “Yes - please send pings” for us to pick up data.
The data below is not for all users of our tools, it is only for those who have said yes to participate - but with the amount of pings we do get (currently 28K/day, 6+ million/year) I believe it is a signficant high part of our user base to at least give an idea about the trends and divisions of our user base.
I’ve tried my best to validate and ensure I report correct findings - please leave a comment if you believe I’ve made an error or there is some other metric you would like to know about.
And finally - the content, observations and conclusions in this blog are my personal views based on my intepretation of the analytics data I have access to.
Methodology
The way our ping-back works from a highlevel is that on startup of an Eclipse instance a HTTP GET is made to Google Analytics and here the data is collected as if it was a web page hit (i.e. Google Analytics gathers information from the network connection, HTTP headers and URL parameters).
We only make maximum one ping every 24-hour per Eclipse Instance and it is only on startups. Thus if you have your eclipse instance running for six days, you only make one ping in those six days.
I’ve used Google Analytics web UI and data extraction features as a basis for the findings below.
Operating Systems
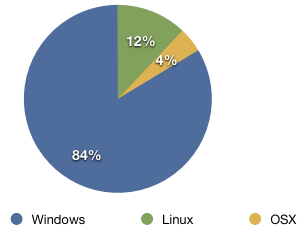
If you should be in doubt, Microsoft Windows is by far the most dominant desktop OS out there when it comes to desktop OS, and this is no different for users of JBoss Tools.
Here is Operating Systems for June-July 2012:
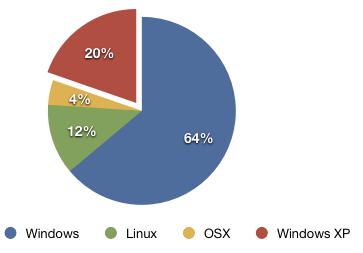
Even if you separate out Windows XP on its own then Windows XP users outnumber Linux + OSX users combined.
Operating Systems for June-July 2012 with XP separated out.
I saw these same splits in our usage tracking (Windows: ~80%, Linux: ~15% OSX: ~5%) and I was worried we were having some bug in our ping-back code.
I therefore got access to Google Analytics for several of our jboss.org project sites including all of community.jboss.org and here the splits are more or less the same no matter how you slice and dice it. Thus either this split is true or Google Analytics is wrong everywhere.
What surprises me though is that Windows is even growing over time, both on site visits and JBoss Tools ping back:
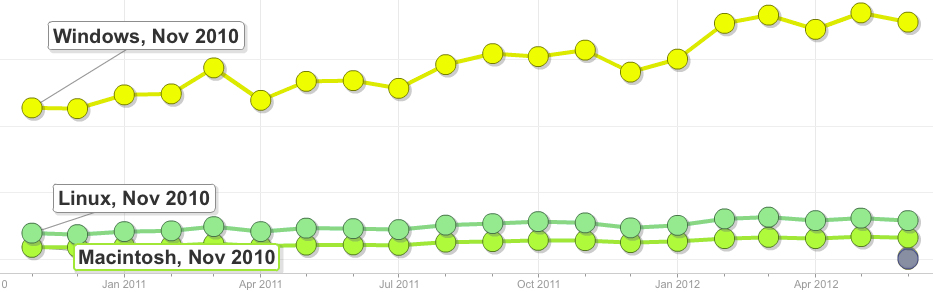
I’m sure the growth of Windows here does not resemble the growth of operating systems world wide, I believe it is more a function of more and more “real world” industrial users picking up and using JBoss technology.
I know it surprises alot of people both inside and outside of my current employer (Red Hat) who would like to think Linux is not just primarily a server side OS anymore; and I know of a lot of conference attendees who claims OSX is “everywhere”. It might be everywhere at conferences, but not out there in the “real world”.
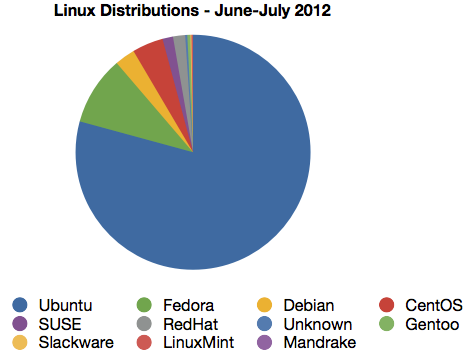
Linux Distributions
Once you get pass the fact Windows is by far the biggest desktop platform then it is interesting to look at how the various Linux distributions spread out.
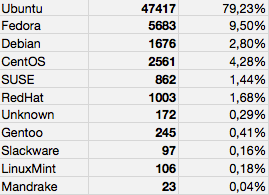
The following charts shows a summary of Linux distributions as detected by our ping-back code to detect Linux distributions.
Our ping-back report back the distribution name and version as found in various distribution specific files and I’ve taken these reports and stripped out the versions and just looked at the distribution name.
I unfortunately do not have any way of confirming the validity of these numbers because Google Analytics does not report this level of detail for specific websites and looking at distrowatch.com the numbers are very different. Probably the difference should be explained in difference of Desktop vs. Server, Linux users vs. JBoss/Middleware users.
In any case please do take these uncertainties into account when considering these numbers.
The graphs below is for the period June-July 2012:
Countries
One of my favorite images from Google Analytics is the map showing city activity across the world.
City Activity 2011-2012 ( a full year )
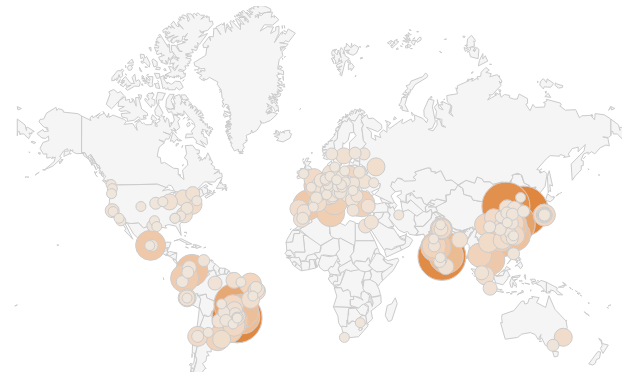
That is showing JBoss Tools being used across 6 continents, 177 countries in 9644 cities; and as you can see it is not United states nor Europe that is lighting up the most.
Most active cities are in areas such as Brazil, China and India, which also is revealed in the Top 10 countries list for 2011-2012.
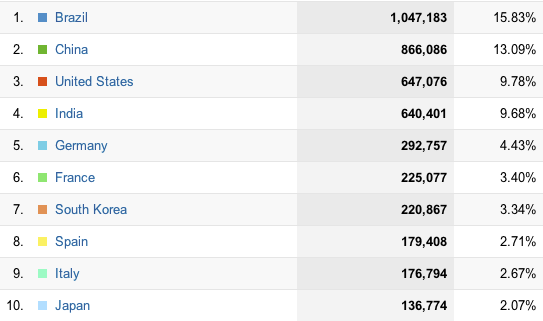
I apparently need to learn to write blogs in Portuguese and Mandrin!
I was asked how the Operating System varies across countries and that was a bit trickier to extract because Google Analytics starts sampling when the dataset gets too big - but here is a table showing OS per Top 10 countries based on 80% of data collected in June 2012.
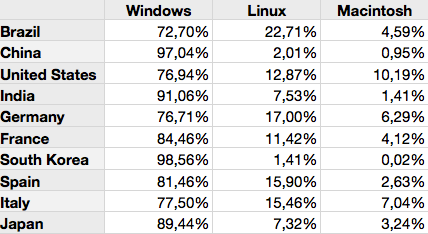
It’s interesting to see United States OS X usage be almost twice as high as any other country and countries like China and South Korea having ~98% usage of Windows.
Where as countries like Brazil has a much higher percentage using Linux.
Users from Spain and Italy have same Linux usage but Italy has twice as many Mac users.
Screen resolution
In the last year, we’ve seen no less than 7995 different screen resolutions.
The number was much higher than I expected, and I believe this is caused by differences in how Java/SWT differs across various OS releases on how the desktop resolution is reported; thus the Top 10 screen resolutions is a rough estimation.
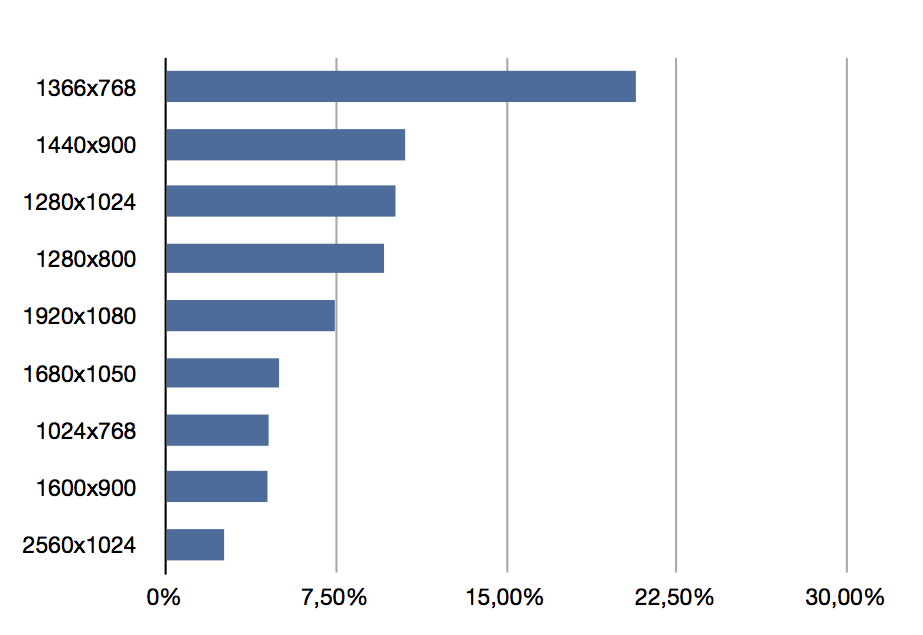
What is interesting though is that the number of observed 1366x768 screen resolutions have grown much more than other screen resolutions.
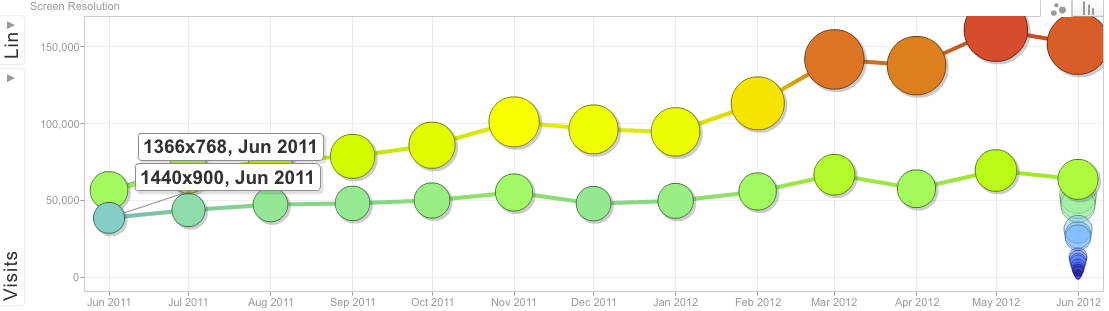
It’s as if everyone started to get more and more HD laptops/displays the last couple of months.
One thing I did notice was that there is a few (or just one?) user that has some very large multi-screen setups. Tried to visualize this by showing smallest (640x480), most common (1366x768) and largest observed screen resolution (11520x2400) relatively to each other in this diagram:

The large resolutions are probably multiple monitors, not just one single monitor. My guess is the largest reported is a couple of WQUXGA screens. think I got screen envy!
Java version
Java 7 was released “recently” and I got more than a few request asking why we still support Java 6 when it is EOL and Java 7 is the new kid in town.
The answer is in the following graph. It shows the uptake of the most popular Java versions over the last year.
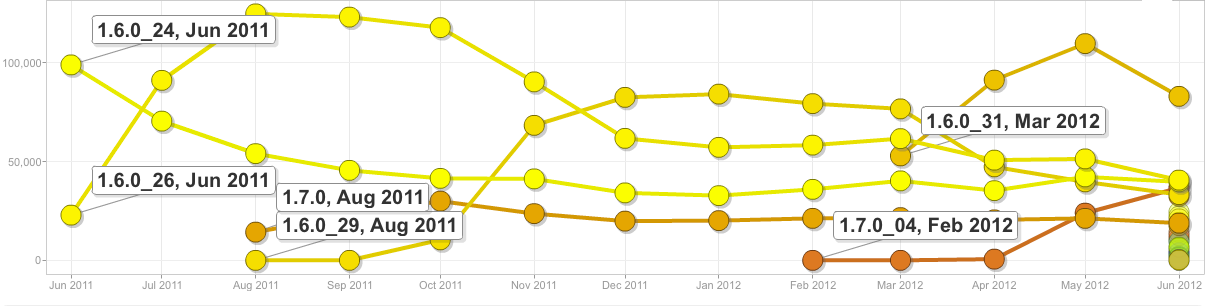
You can see Java 1.6.0_26 overtake 1.6.0_24 in July 2011 and similar 1.6.0_29 takeover in November 2011 and finally 1.6.0_31 is the current big winner.
Java 1.7 had only little uptake, and its only recently Java 7 is above 20% usage.
The current %’s shows a clear 76% usage of 1.6, following with Java 1.7 with 22% and then a few (2%) is still using Java 1.5 - we, even had a few Java 1.8 users but they are still below 0.01% thus not visible on any of the graphs.
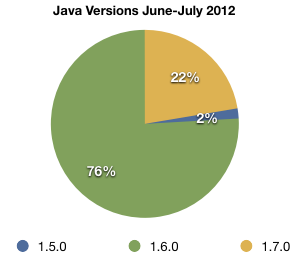
I expect over the next year Java 1.7 will have a bigger uptake, but I would not bet on it overtaking Java 1.6 anytime soon.
Conclusions
One nice thing to conclude from our usage tracking is that we can see that JBoss Tools keeps growing and has more and more uptake and I’m personally very happy to see that.
Beyond that my primary lesson from the gathering of analytics is that Windows XP is bigger than Linux and OS X combined. Windows overall is where the majority of real-world users are.
There are probably also lot of interesting political and world-economic comments that can be made about the Top 10 countries usage of Operating Systems. But this is just JBoss Tools users, thus not sure how this maps to the world-arena but one thing I do think we can conclude is - each country has very different composition of users/demographics; but they all primarily uses Windows.
Therefore if you are doing any work on tools, frameworks or applications that relate to JBoss user/developer, please remember to test it on Windows, including Windows XP no matter how much you hate this OS your users are using your applicaiton/frameworks to make their own life easier.
Before anyone put words in my mouth any say this means Linux and OS X users should be ignored because they are such a small percentage - that is not true since the uptake of Windows over time shows that Linux/OSX is where a good portion of the “early adopters” are.
That is it for this time, let me know what you think - does this match your expectations ? Could we improve the dataset/statistics somehow ?
Have fun,
Max
Comments