Deprecated
Consumable
- The project should be easy to consume:
- As a library.
- As a standalone server.
- As a container.
- The amount of dependencies should remain minimal (dependencies chosen carefully, this doesn't mean 0 dependency)
- It should be usable in a non full-JavaEE environment (No EJB, Servlet/JAX-RS is ok in reference implementation)
- Shipped as a Web Archive (war), deployable in plain Tomcat/Undetow (For reference implementation, later we can add Undertow native / vert.x...)
Immediate needs
Things of highest priority, we would like a POC of those by end of May
Storing metrics
Remote interface - REST
- Insert single metric
- id, timestamp, value, unit
- Insert range metric ?
- id, timestamp, period, min, max, avg, unit
- Increment metric counter
Retrieving metrics
Remote interface - REST
- Retrieve Metric by Time Range (and optional filters like priority)
- Retrieve Metric Group By Time Range (optional filters)
- Retrieve Multiple Metrics by Time Range (optional filters)
Charts
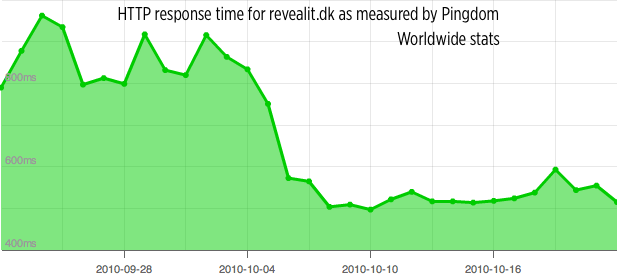
We will provide Angular directives for some charts. By nature we are mostly interested by charts that represent a value over some period of time.
- Linear chart to represent the value of a metric at a specific time and drill into detail around a specific time range (and eventually overlaid events)

- With ability to have multiple metrics on the same chart for comparison (or same metric with different timing, for instance to compare metrics of the current week with the week before [scale selection logic can get complicated with multiple metrics])
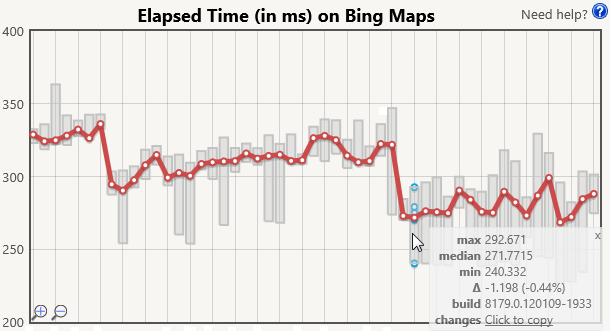
- Chart representing max/min/average value of a metric with specific time granularity
- <place holder>
Future needs
Things that we may want into consideration now or keep for later to achieve the immediate needs. This may also be part of additional/separate projects.
Support for Custom Dashboards
Dashboard templates (stored/retrieved/shared via github) for:
- Server Centric Views (Data Center oriented)
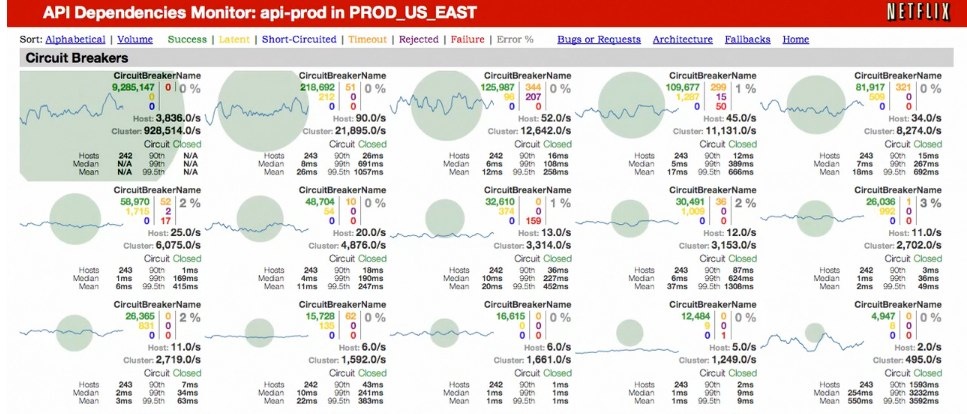
- Cloud Centric Views (Application/Service oriented)

- Summary Views
- Mobile
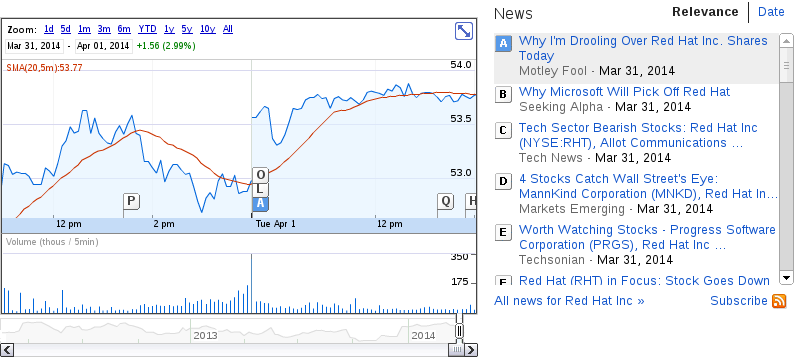
Support for discrete events
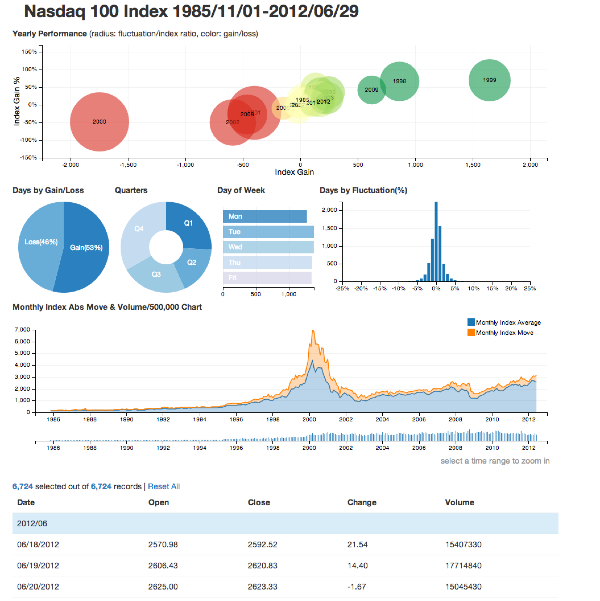
Once metrics will be supported, adding discrete events makes a lot of sense, an event may explain why some metrics behave the way they do.
An example below where the metric is a stock price and events are publication of an article which may explain why the price went up or down significantly.
An event may have properties to search on (On the illustrated example, one may want to search events of one author between some dates...)
Events can be categorised (grouped) and filtered (earnings events, press events, conferences) created by users
Events can have a priority (Critical, Major, Info, Debug) these can be created by users
Support for alerts
A monitoring solution would want the ability to add alerts if a metric behaves a certain way.
Examples:
- Metric above a value. (Stock price hit the price you want, response time is too high...)
- Metric below a value (Stock price reached the price you defined, number of available connection pools is getting critical...)
- Metric trend (memory leak prevention...)
Things that are out of scope
For clarity...
The project would not provide:
- An analytic solution
- While one can argue that a visitor reaching a website is an event or the number of connected user is a metric, the project do not plan to be an alternative to any analytic solution.
- We may add capabilities to search events based on event properties and one may use the project
Comments