Web Console Monitoring
Web Console monitoring builds off of JBossMonitoring which was added to JBoss 3.2.4. Read JBossMonitoring to get a feel of things you can configure for Web Console monitoring.
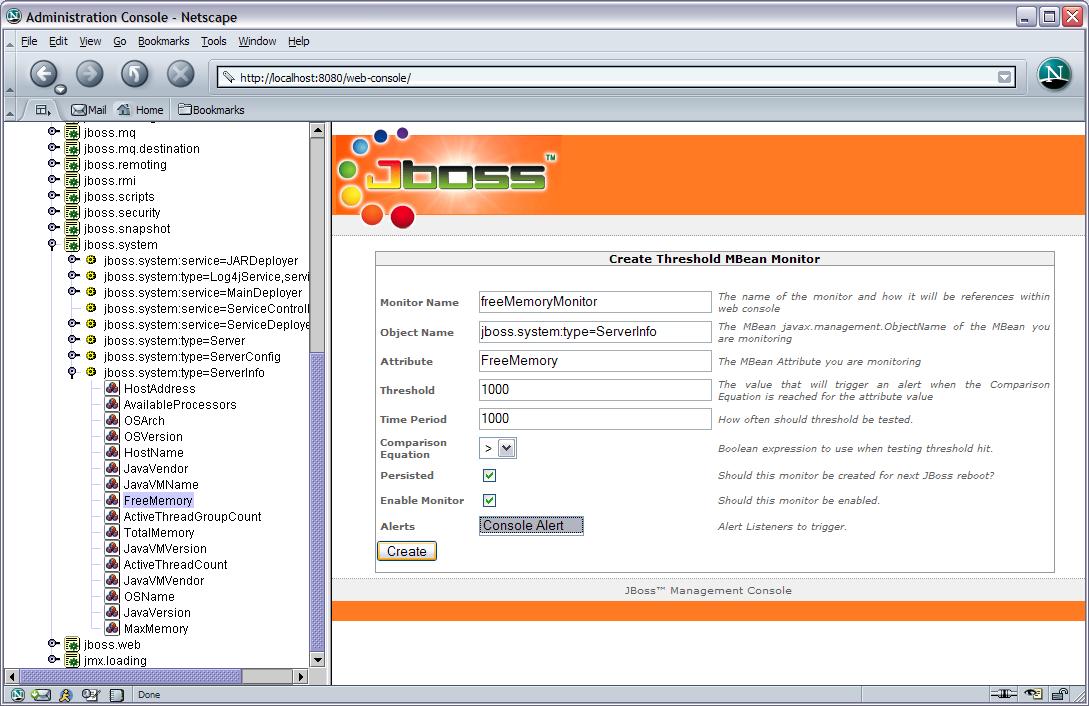
Within the web console you can monitor any string or numeric JMX attribute by right clicking on a attribute in the tree and selecting create monitor. When a threshold ceiling or floor is reached, the monitor will send
out a JMX notification that can be picked up by an Alert Monitor. There are currently only Console (System.out) alerts and Email alerts. See the JBossMonitoring page for more info. Here are some screen shots.
Create Monitor

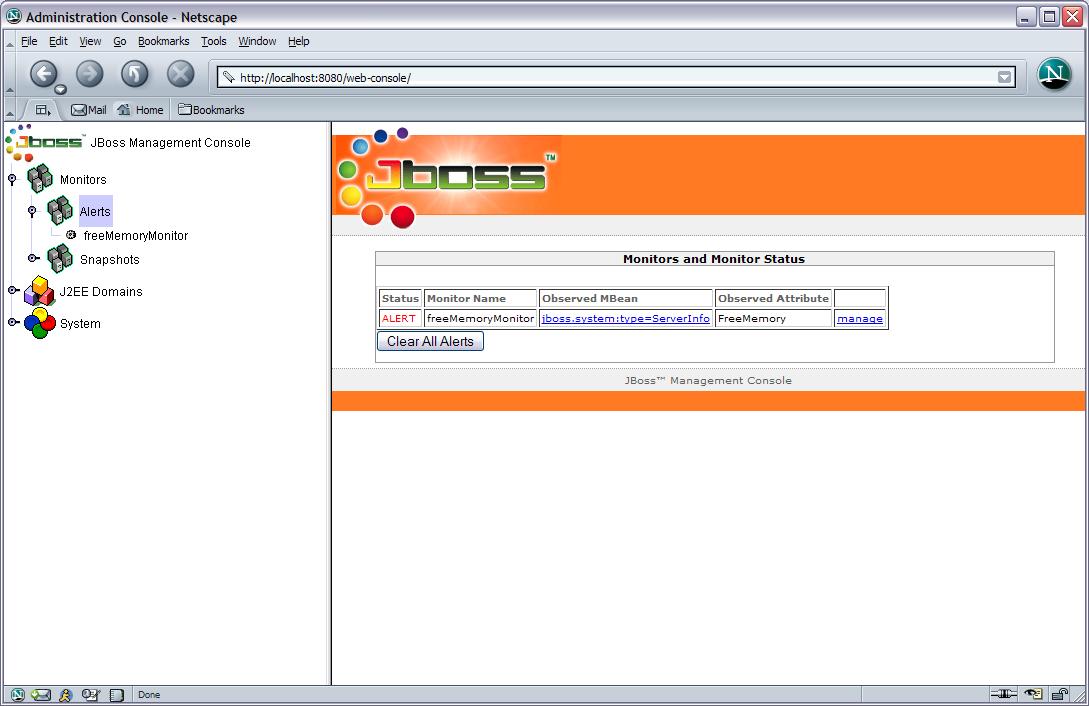
Monitor Summary
You can also view the summary of all monitors. View the tree view, click on the alerts tree node and you
will get the summary of all monitors, their status (ok, or alerted), and a way to manage them.

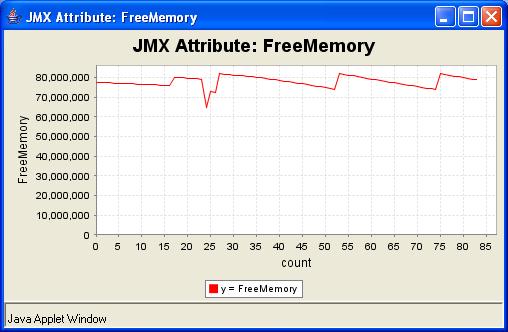
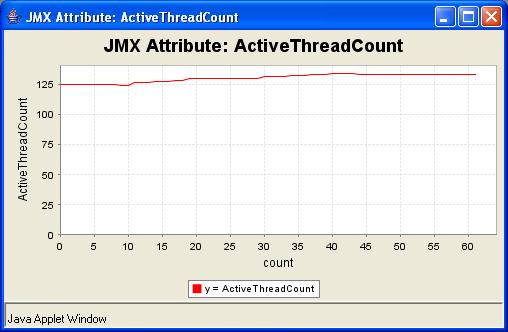
Real Time Graphing
You can also produce real-time graphs of any attribute of any mbean in the JMX container. And since almost all of the JBoss code is built as mbeans, you can watch just about anything. Of particular interest are things like free memory and thread counts, etc.


Comments