Purpose of the benchmark
JBoss Cache 2.2.0 Poblano comes with some changes in the product's architecture, through significant refactoring (see this blog on the subject for details). As the major driver behind these changes was code quality (unit testability, readability, etc.) and not performance, we wanted to analyze how performance was affected by such refactoring to ensure there were no regressions in performance, and hence this benchmark. We were very pleasantly surprised.
How the benchmarked was done
For benchmarking we used the CacheBenchmarkFramework. We run the web session simulation test
with the following configuration:
write percentage 20%
read percentage 80%
size of an attribute: 1000 bytes
no of attributes in session: 100
number of requests: 100,000
Following JBossCache configuration files were used for both versions tested (2.2.0.BETA1 Poblano and 2.1.0.GA Alegrias)
Each configuration was run on a cluster varying from 2 to 10 nodes. Each node configuration was:
OS: RHEL4
Processor: Quad CPU, Intel(R) Xeon(TM) CPU 3.00GHz, cache 2048 KB
Memory: total 4037392 kB
Java: Java HotSpot(TM) Server VM (build 1.5.0_11-b03, mixed mode)
Test date: 1st May, 2008
Benchmark results
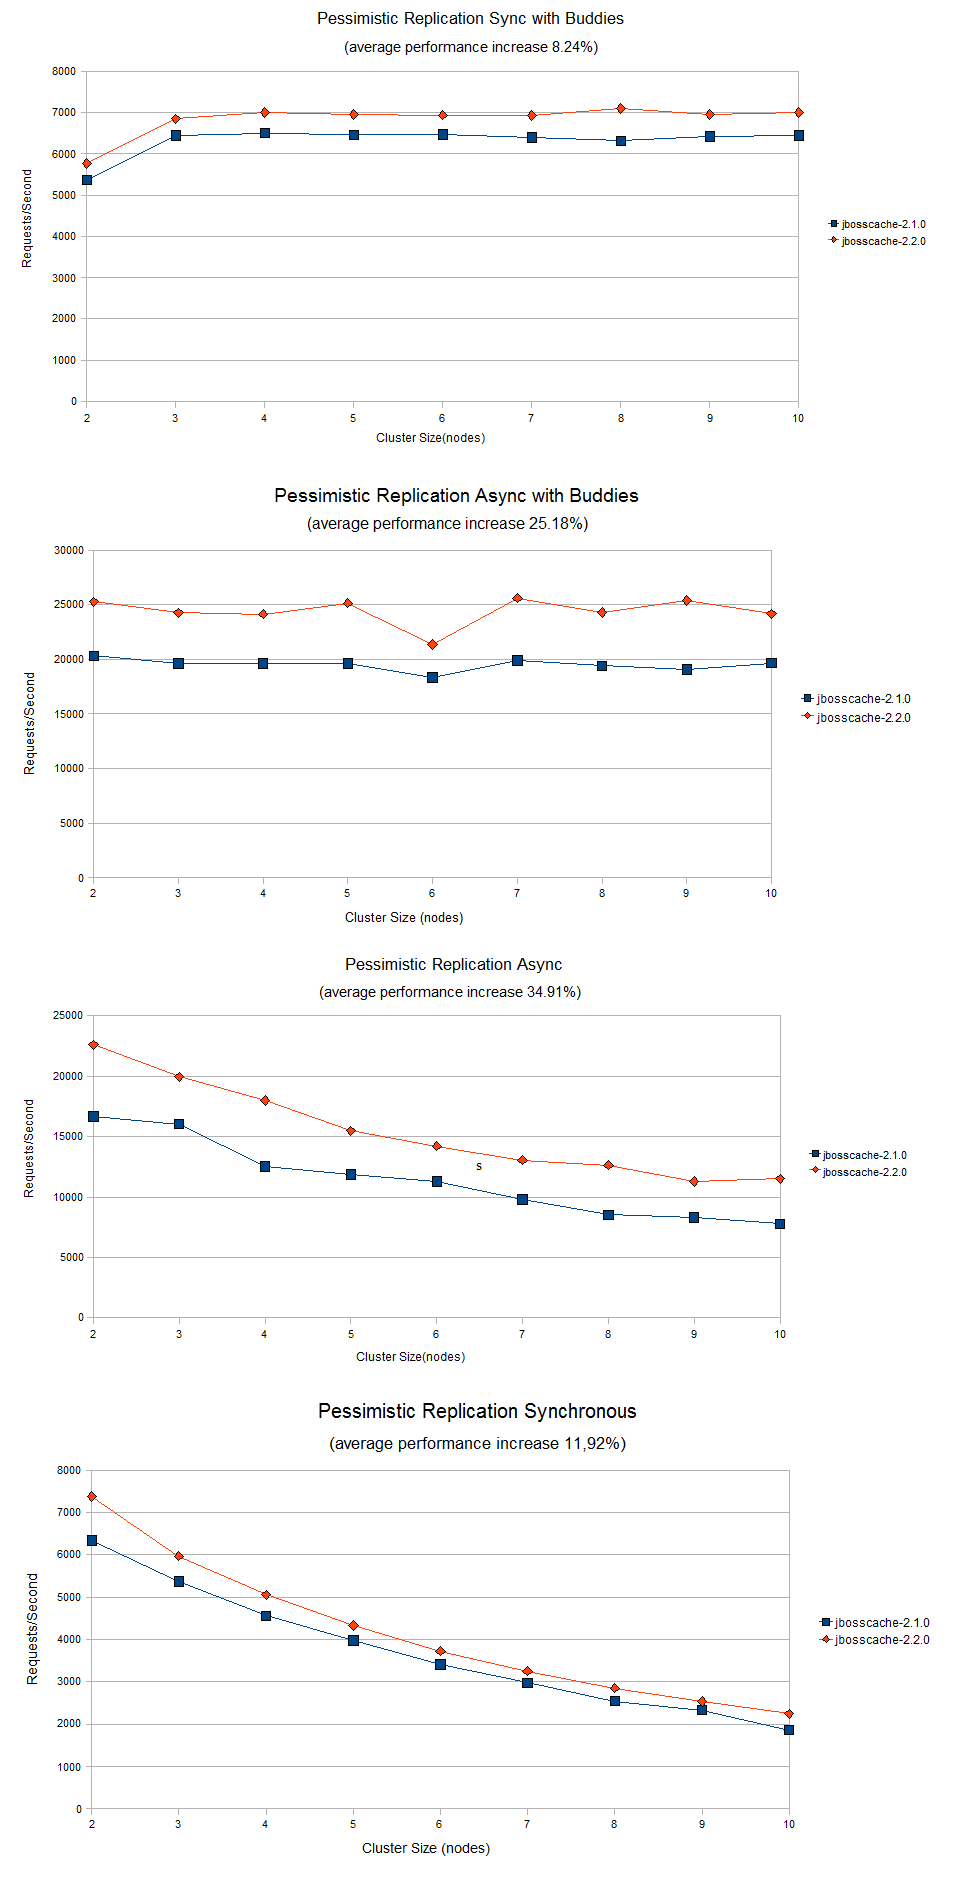
The results of the comparisons are in the attached graph. Poblano outdoes Alegrias in performance with following average increases (percents)
Pessimistic replication sync (buddy repl) - avg 8.24% increase
Pessimistic replication sync (total repl) - avg 11.92% increase
Pessimistic replication async (buddy repl) - avg 25.18% increase
Pessimistic replication async (total repl) - avg 34.91% increase

Comments