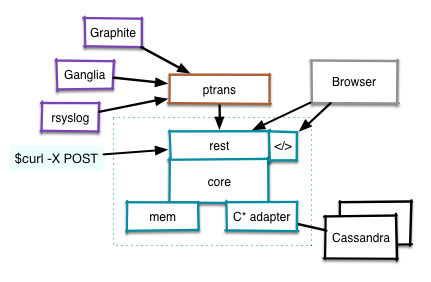
In RHQ-metrics we have a first end-to-end version available. This is far from production ready, but allows to better discuss the scenario and possible implementations. The following picture shows the status quo:

The core "rhq-mertrics" is denoted by the dotted box which can be deployed as a war file (actually 2, the other is to host the UI) inside a WildFly 8 server. The core provides a rest-interface that can be used to deliver data via different means (including curl) or to retrieve data e.g. for charting purposes.
Behind the interface there are the core algorithms that can then talk to either a memory backend or via a Cassandra adapter to a Cassandra storage cluster.
Another component is a Netty-based protocol translator (ptrans, shown in brown) that can receive data packets from other monitoring systems and agents like Graphite tuples, rsyslog via tcp or packets from Ganglia's gmond via IP multicast. Those packets are then translated into the format expected by above REST-interface and forwarded to it. (*)
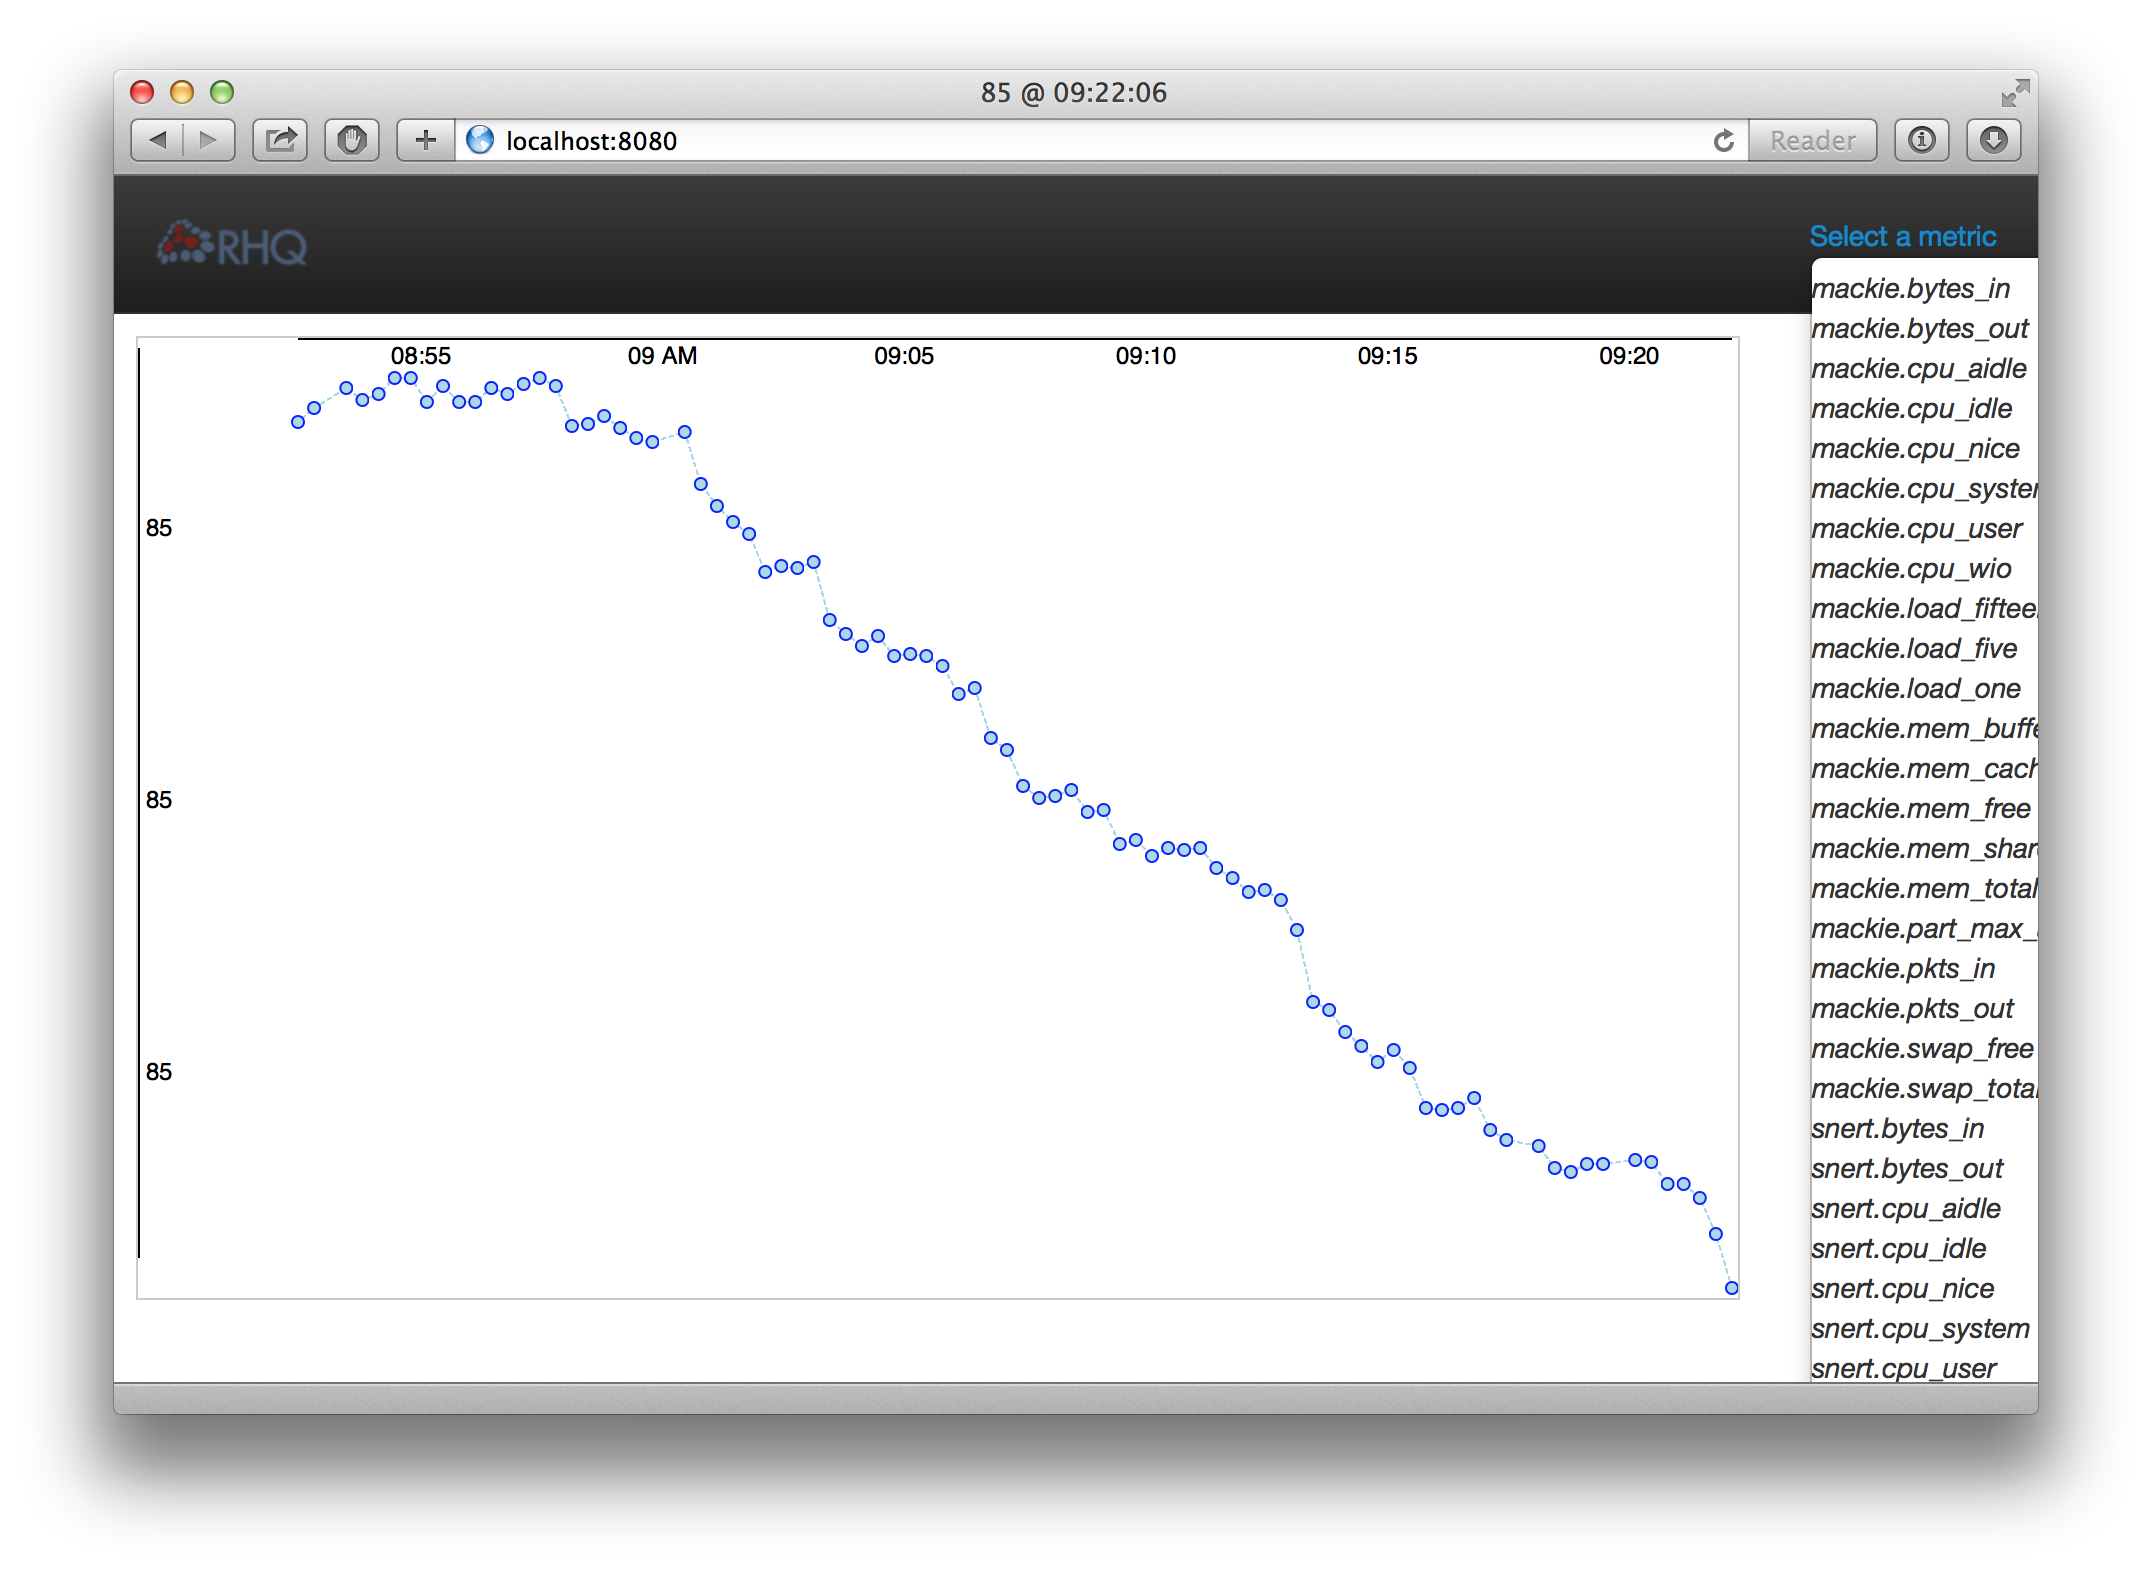
The last part, are AngularJS-based charts - the implementation shown in the next image is purely a placeholder to illustrate the end-to-end scenario, We expect that those are replaced by the real charts in the next few days.
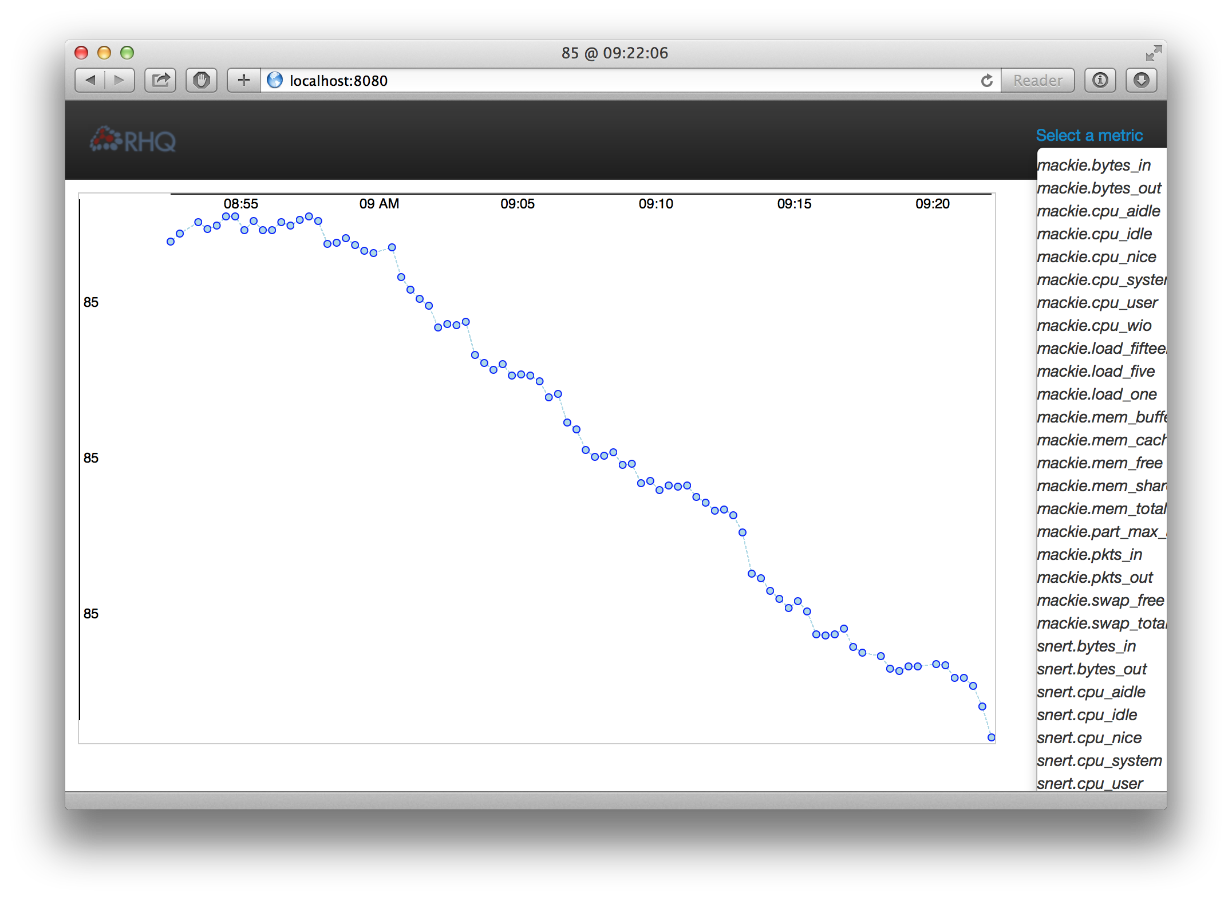
When you select a metric from the dropdown on the right, the UI does a rest-call to retrieve the metrics for the last 8h and display it. The data for the above graph is received from Ganglia's gmond and forwarded through the chain as described above.
*) By slightly modifying the sender backend one could also use this to feed data into the existing RHQ server infrastructure to be able to monitor platforms that run gmond and no rhq-agent.
Comments